Bitcoin - Bears vs Bulls: $100k next?Price recently tapped into a well-defined 4H and daily resistance zone and was met with an immediate rejection. That rejection wasn’t just a reaction, it led to a confirmed market structure shift as price broke the previous low. This transition from higher highs to a lower low signals the first sign of bearish control, flipping the short-term bias and setting the tone for a move lower.
Retest of MSS and Inversion Fair Value Gap
After the break in structure, price retraced directly into the origin of the move, retesting the same zone where the shift occurred. A previously bullish 4H gap has now flipped into resistance, rejecting price perfectly. This inversion, where a bullish imbalance turns into a bearish reaction zone, confirms the change in direction and strengthens the downside narrative.
New FVG as Entry Opportunity
The latest bearish impulse created a clean new fair value gap just above current price. A retest of this gap would offer a high-probability continuation setup, as it aligns with both recent structure and order flow. This zone becomes the critical level for bears to defend, and unless price reclaims it, the expectation remains for continuation toward lower liquidity.
Liquidity Outlook and Bearish Target
Below current price, a large pool of liquidity is sitting just above a major psychological round number. That level hasn’t been swept yet and is a likely downside magnet. With no meaningful support between the current FVG and that draw on liquidity, price is likely to reach for it next. This fits the typical sequence following a market structure shift: rejection, shift, retest, continuation, and liquidity sweep.
Momentum and Contextual Confluence
Zooming out slightly, the current move fits within broader bearish momentum that has been developing across timeframes. There’s no sign of strong bullish absorption, and each push higher has been met with efficient selling. This isn’t a chaotic breakdown, but a controlled sequence of lower highs and lower lows, supported by clean structural shifts and consistent rejection zones.
Conclusion
The chart tells a clear story. A clean rejection from a key resistance zone led to a confirmed bearish structure shift, followed by a textbook retest and fresh fair value gap. As long as price remains below that gap, the setup favors continuation lower, with the nearest liquidity pool being the most likely draw. This remains a high-probability bearish scenario until proven otherwise by a shift back above invalidation levels.
___________________________________
Thanks for your support!
If you found this idea helpful or learned something new, drop a like 👍 and leave a comment, I’d love to hear your thoughts! 🚀
Community ideas

GOLD → Geopolitical risks are driving gold prices up. To ATH?FX:XAUUSD is updating its interim highs as it retests resistance at 3435 amid escalating tensions in the Middle East. Economic risks are on the rise...
Gold rose 1.5% on Friday in Asian trading as investors sought refuge from escalating tensions between Israel and Iran. The price approached 7-week highs and could reach $3,500 if the conflict intensifies. The US and Israel have warned of serious consequences, while Iran has promised to respond. Geopolitics has overshadowed economic news, and markets are pricing in the possibility of a Fed rate cut in September.
Technically, the price is emerging from a local consolidation and testing a fairly important resistance level, forming a false breakout and correction. But this does not mean that the price will fall...
Resistance levels: 3425, 3435, 3461
Support levels: 3408, 3400, 3377
If gold consolidates above 3425 and continues to storm the resistance, growth may continue, and at the moment, there is a fairly high probability of a retest of the ATH. However, the ideal scenario would be a retest of the zone of interest 3408 - 3400 and the capture of liquidity before continuing growth.
Best regards, R. Linda!

Update of the Bullish/Bearish Catalysts for Gold prices________________________________________
⚡️ Gold’s Pullback: A Reset, Not the End
After peaking above $3,500/oz in April, gold’s slide back toward $3,210 marks a sharp—but not unusual—correction. What’s changed in the gold narrative? The rapid unwinding of panic bids as the Fed stays hawkish, the dollar flexes, and risk appetite returns. But beneath the surface, multiple structural drivers—old and new—are shaping gold’s next act.
________________________________________
1. Fed “Higher for Longer” Policy Bias (9/10)
Still the #1 driver.
With inflation sticky and the U.S. labor market robust, the Federal Reserve’s reluctance to cut rates (4.25–4.50%) is pinning real yields near multi-year highs. This erodes the appeal of non-yielding assets like gold, particularly for Western investors.
🦅 Watch for any dovish shift—a single Fed pivot could reignite gold fast.
________________________________________
2. U.S. Dollar Resilience (8.5/10)
The DXY recently surged above 101, buoyed by relative U.S. growth outperformance and ongoing EM weakness. Since gold is dollar-priced, a strong greenback makes gold more expensive for non-dollar buyers, crimping global demand.
💵 Sustained dollar strength could push gold closer to $3,100 unless countered by inflation or new geopolitical stress.
________________________________________
3. Central Bank Buying & “De-Dollarization” Flows (8/10)
This is the new wild card.
Countries like China, India, Turkey, and Russia are accelerating gold reserves accumulation—partly to hedge against dollar-centric sanctions and diversify away from U.S. Treasuries. Q2 2025 data shows a 35% jump in net central bank purchases year-on-year.
🏦 This bid underpins the gold market even when ETFs and retail are sellers.
________________________________________
4. U.S.–China Trade Normalization (7.5/10)
The May 2025 Geneva agreement was a big de-risking event. While tariffs haven’t vanished, steady progress on tech and agriculture reduces tail risk for global trade, putting downward pressure on gold’s safe-haven premium.
🌏 Any breakdown or tariff surprise could quickly reverse this.
________________________________________
5. Algorithmic & Quant Trading Flows (7/10)
Gold’s volatility is now heavily influenced by systematic funds. CTA (commodity trading advisor) and quant-driven selling accelerated the recent drop once $3,300 was breached. This non-fundamental selling creates overshoots—but also sharp reversals on technical bounces.
🤖 Expect snapbacks when positioning reaches extremes.
________________________________________
6. U.S.–U.K. & EU Trade Deals (6.5/10)
Both deals have reduced the global uncertainty premium. While the economic impact is moderate, improved global relations have pushed capital into equities and away from gold.
🇬🇧 Keep an eye on political risk, especially if new tariffs or Brexit-related shocks re-emerge.
________________________________________
7. India–Pakistan and Middle East Geopolitical Risks (6.5/10)
Tensions have cooled, but remain a latent driver. The India–Pakistan border saw restraint in May; Iran–U.S. talks are “cautiously positive.” Any surprise flare-up, especially involving oil, can quickly restore gold’s safe-haven bid.
🕊️ Event-driven spikes likely, but not sustained unless escalation persists.
________________________________________
8. ETF Flows, Retail & Institutional Demand (6/10)
ETF inflows have slowed sharply in 2025, but central bank and Asian buying partly offset this. U.S. retail interest has faded due to higher Treasury yields, but any sign of real rates rolling over could spark new inflows.
📈 ETF demand is now more a symptom than a cause of price moves.
________________________________________
9. Technological Demand & Jewelry Trends (5.5/10)
Longer-term, gold’s use in electronics, EVs, and green tech is rising modestly (up ~3% YoY). Indian and Chinese jewelry demand—seasonally soft now—could rebound late 2025 if income and sentiment recover.
📿 Not a short-term driver, but a steady tailwind in the background.
________________________________________
10. Fiscal Risk & U.S. Debt Sustainability (5.5/10)
Rising concerns about the U.S. debt trajectory, especially if deficits widen or the U.S. nears a shutdown or downgrade, can trigger flight-to-quality bids for gold. This is not the main driver now, but is a key “black swan” risk if Treasury auctions stumble.
💣 Could move up the list rapidly on negative headlines.
________________________________________
🌐 Other Catalysts to Watch:
• Israel – Iran tensions in the Middle East – limited impact on gold prices.
• Crypto Market Volatility (5/10): Periods of sharp crypto drawdowns have triggered some rotation into gold, but the correlation is inconsistent.
• Chinese Real Estate Stress (5/10): Signs of further slowdown or crisis (e.g., major developer defaults) could boost gold as a defensive play in Asia.
• Physical Supply Disruptions (4/10): Mine strikes, export restrictions, or transport bottlenecks can create localized price spikes, but rarely move the global market for long.
________________________________________
🏆 2025 Gold Catalyst Rankings (with Impact Scores)
Rank Catalyst Strength/10 Current Impact Direction Notes
1 Fed “Higher for Longer” Policy 9.0 Very High Bearish Key yield driver
2 U.S. Dollar Resilience 8.5 Very High Bearish Hurts non-USD demand
3 Central Bank & “De-Dollarization” Buying 8.0 High Bullish Structural support
4 U.S.–China Trade Normalization 7.5 High Bearish De-risks global trade
5 Algorithmic/Quant Trading Flows 7.0 High Bearish Magnifies volatility
6 U.S.–U.K./EU Trade Deals 6.5 Moderate Bearish Risk appetite rising
7 India–Pakistan/Mideast Geopolitics 6.5 Moderate Neutral Event risk
8 ETF, Retail & Institutional Flows 6.0 Moderate Bearish Trend follower
9 Tech/Jewelry Physical Demand 5.5 Low Bullish Seasonal uptick possible
10 U.S. Debt/Fiscal Sustainability 5.5 Low Bullish Potential tail risk
11 Crypto Market Volatility 5.0 Low Bullish Risk-off flows (sometimes)
12 China Property Crisis 5.0 Low Bullish Asian safe-haven buying
13 Physical Supply Disruptions 4.0 Very Low Bullish Rare but possible
________________________________________
🚦Where Next for Gold?
• Current price: ~$3,210/oz
• Key support: $3,150/oz
• Key upside triggers: A dovish Fed surprise, sharp dollar reversal, sudden geopolitical event, or central bank “buying spree.”
• Risks: Extended strong dollar, yield spike, no escalation of global risks.
________________________________________
Summary Table: 2025 Gold Price Catalysts Comparison
Catalyst 2024 Score 2025 Score Change Impact Direction (2025) Commentary
Fed Rate Policy 9 9 – Bearish Unchanged, still dominant
U.S. Dollar 8 8.5 ↑ Bearish Gained in strength
Central Bank Buying 7 8 ↑ Bullish Grown in importance, especially in Asia
U.S.-China Trade 7.5 7.5 – Bearish Still relevant, deal holding for now
Algorithmic/Quant Flows 6 7 ↑ Bearish Systematic trading influence is rising
Geopolitics (excl. Russia/Ukraine) 6 6.5 ↑ Neutral Slight increase, mostly latent risks
ETF/Institutional Flows 5 6 ↑ Bearish Slower, but still influential
Jewelry/Tech Demand 4.5 5.5 ↑ Bullish Tech/jewelry more important now
U.S. Debt/Fiscal Risk 5 5.5 ↑ Bullish Gaining attention with deficit concerns
Crypto Market Volatility 4 5 ↑ Bullish Correlation growing, but inconsistent
China Property Risk N/A 5 NEW Bullish Added due to emerging Asian risk
Physical Supply Disruption 3.5 4 ↑ Bullish Minor, only spikes on rare events
________________________________________
🥇 Bottom Line:
Gold’s retreat reflects a rebalancing of risk and yield, but the stage is set for sudden moves—especially if the Fed blinks, the dollar falters, or new shocks emerge. The top three catalysts (Fed, Dollar, Central Bank buying) are especially worth watching as we head into the second half of 2025.

USD/CAD.1week chart pattern.It looks like me discussing a trade setup for USD/CAD with:
Sell Entry: 1.36200
Target Point 1: 1.23504
Target Point 2: 2.31000 ← This seems like a mistake
Let’s break it down:
---
🔍 Trade Analysis:
Sell at 1.36200: This is a reasonable short entry, near recent resistance (depending on current market context).
Target Point 1 (1.23504): This is plausible, as it's a historically significant support level — a good long-term take-profit zone.
Target Point 2 (2.31000): This appears illogical for a short (sell) position — it's higher than the entry price. If you're shorting, you profit from a decline, not a rise.
---
✅ Corrected Setup (Sell Idea):
Sell USD/CAD @ 1.36200
Take Profit 1: 1.30000 (medium-term support)
Take Profit 2: 1.23500 (long-term support)
Stop Loss: 1.37200 (just above recent highs)
Would you like a chart analysis or backtest of this strategy?

EURUSD Potential UpsidesHey Traders, in today's trading session we are monitoring EURUSD for a buying opportunity around 1.14500 zone, EURUSD is trading in an uptrend and currently is in a correction phase in which it is approaching the trend at 1.14500 support and resistance area.
Trade safe, Joe.
USD/CHF,4h chart pattern..USD/CHF buy trade setup based on my input:
---
✅ Trade Setup:
Buy Entry: 0.81300
First Target (TP1): 0.82300
Second Target (TP2): 0.83500
---
📊 Trade Metrics:
1. TP1 Distance:
0.82300 - 0.81300 = 0.01000 (100 pips)
2. TP2 Distance:
0.83500 - 0.81300 = 0.02200 (220 pips)
---
🛑 Suggested Stop-Loss (if not defined):
A common approach would be to place it below the recent swing low or a round level for risk management. Example:
Stop-Loss (SL): 0.80800 (50 pips risk)
---
⚖ Risk-Reward Ratios (if SL = 0.80800):
To TP1: 100 / 50 = 2.0 R/R
To TP2: 220 / 50 = 4.4 R/R
---
Would you like a visual chart or technical breakdown (e.g., support zones, confirmation candles) for this pair?

Trading Signals for Gold Sell below $3,443 (21 SMA -7/8 Murrray)The XAU/USD trend remains bullish as long as the price consolidates above 3,384.
Therefore, it would be prudent to buy gold as long as the price consolidates above3,444, where the 7/8 Murray level is located.
Gold's volatility will continue over the next few days, so we believe it could move between 3,386 and 3,356.
Consequently, if gold consolidates and breaks above 3.498, it would be seen as a buying opportunity, with targets at the 8/8 Murray level around 3,600/
Last tow months, gold gapped around 3,498. This will likely be seen as a buying opportunity if the price breaks above the psychological level of $3,439
Conversely, below the R_1 around 3,443, gold will be seen as an opportunity to sell, targeting 3,400 and the bottom of the uptrend channel around 3,338.
The RSI indicator is showing a negative signal, so we must be cautious when buying, as a very strong technical correction could occur.

SILVER (#XAGUSD): Strong Bullish Move Ahead?!It appears we've seen a legitimate liquidity grab following a test of a crucial daily/intraday structure on 📈SILVER.
After a false breakout of the highlighted area, the price rebounded and broke through a significant downward trend line and a minor horizontal resistance on the 4H chart.
I believe the market could stay bullish and potentially reach at least the 36.88 level again.

Euro can reach resistance line of channel and make correctionHello traders, I want share with you my opinion about Euro. Previously, price was trading inside a downward channel, gradually declining from the resistance line while forming a series of lower highs and lower lows. During that phase, sellers were clearly in control, and every attempt to grow was met with pressure near the channel’s upper boundary. However, that trend shifted once the price broke through the resistance line, confirming the end of the bearish momentum and the start of a new upward structure. After the breakout, EUR entered an upward channel, supported by multiple bullish impulses and consistent reactions near the support line. Price continued to rise, pushing through the support area and current support level around 1.1420. This upward movement showed strong bullish conviction, especially after the clean breakout and consolidation inside the channel body. Now the pair has approached the resistance line of the rising channel, where previous impulses typically slowed down or reversed. Given the channel geometry and past market behavior, I expect Euro to react to this upper boundary and move downward. For this reason, I set my TP at 1.1325, which aligns with the support line of the upward channel. Please share this idea with your friends and click Boost 🚀
Disclaimer: As part of ThinkMarkets’ Influencer Program, I am sponsored to share and publish their charts in my analysis.

Lingrid | GOLD bullish Extension from the KEY Support ZoneOANDA:XAUUSD is climbing within a clean upward channel after rebounding strongly from the 3338 zone and forming higher lows. The recent breakout above the 3398.4 area signals a trend continuation setup toward the resistance line near 3465. Price is now testing the broken trendline from above, which could act as a launchpad for the next leg up.
📈 Key Levels
Buy zone: 3380–3390
Sell trigger: drop below 3380
Target: 3465
Buy trigger: bounce from 3400 zone with strong volume
💡 Risks
Rejection near 3440 may trigger a false breakout trap
Gold’s momentum may stall if it loses the 3380 trendline
Broader macro data could override technicals near resistance
Traders, if you liked this idea or if you have your own opinion about it, write in the comments. I will be glad 👩💻

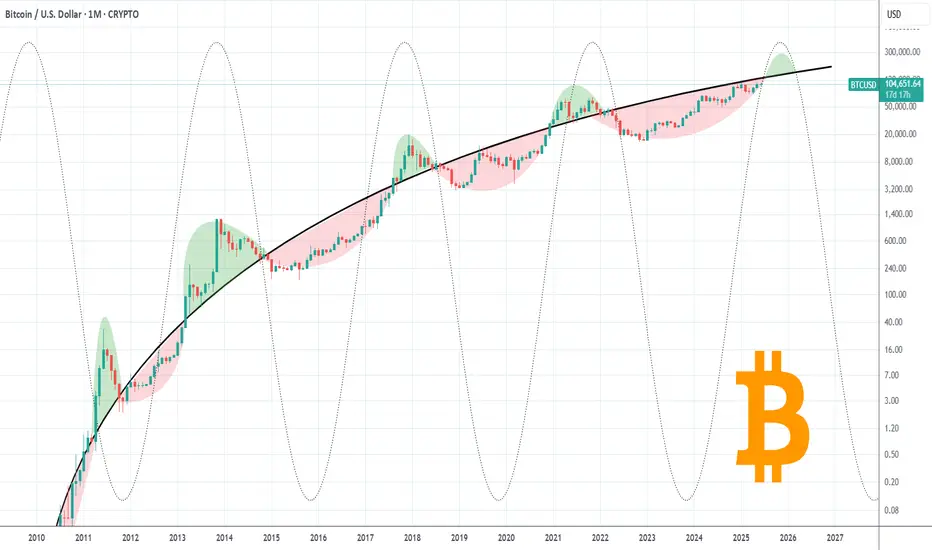
BITCOIN is only now starting the final Cycle rally!Bitcoin (BTCUSD) took a hit overnight following the Israel attack on Iran and at the moment the consequences of that action can't be quantified in great detail but on the long-term the bullish trend seems intact.
In fact it remains below the historic Pivot Growth Curve (PGC) that has separated BTC's peak pattern (green Arcs) from bottom and accumulation (red Arcs), and could be tested by next month.
Once broken, the real rally towards the Cycle's peak can start, with most previous studies we conducted showing that $150000 is a fair (if not modest) estimate.
Are you worried about the latest geopolitical conflict or this chart is enough to give you long-term assurances? Feel free to let us know in the comments section below!
-------------------------------------------------------------------------------
** Please LIKE 👍, FOLLOW ✅, SHARE 🙌 and COMMENT ✍ if you enjoy this idea! Also share your ideas and charts in the comments section below! This is best way to keep it relevant, support us, keep the content here free and allow the idea to reach as many people as possible. **
-------------------------------------------------------------------------------
💸💸💸💸💸💸
👇 👇 👇 👇 👇 👇
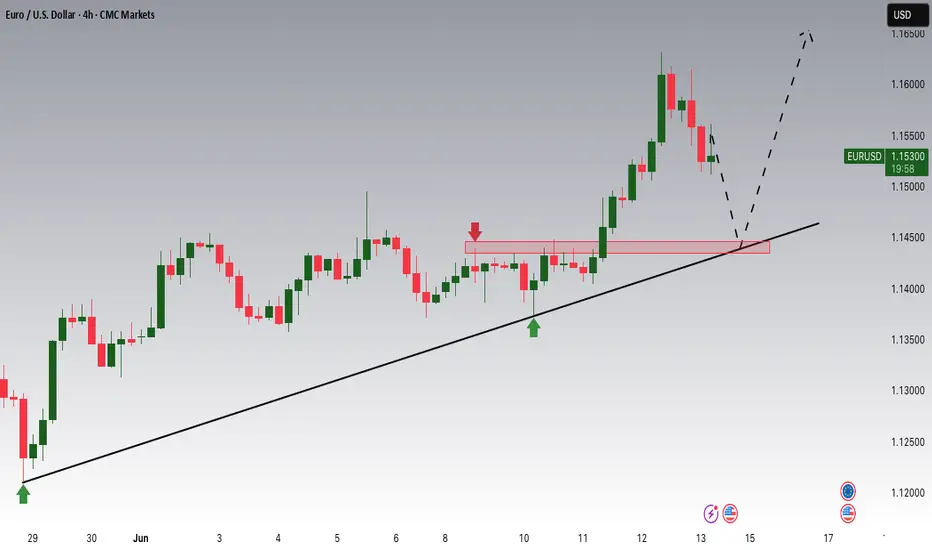
EUR/USD - Daily highs taken, now what?Introduction
The EUR/USD made a strong move higher today, establishing a clear uptrend on the 4-hour chart. With this latest push, it swept the daily liquidity above the previous high. The question now is whether the EUR/USD will continue moving higher or if there are opportunities for long entries at lower levels.
Liquidity Sweep
EUR/USD has taken out liquidity above the daily highs, where many stop losses are typically positioned. These stops have now been removed from the market. This area could potentially act as a support and resistance flip. However, if we see a 4-hour candle close below the previous daily high, further downside becomes likely.
Where Can We Look for Buys?
During the recent 4-hour move higher, significant progress was made. This upward movement created a daily Fair Value Gap (FVG) between $1.149 and $1.145. This FVG aligns perfectly with the golden pocket Fibonacci level, drawn from the swing low to the swing high. As a result, this zone forms a strong area of confluence for potential buy positions to target a retest of the highs.
Conclusion
Although we are currently breaking above the previous high, this move has yet to be confirmed as sustainable. Holding above this level is crucial. If a 4-hour candle closes below the previous high, it becomes likely that we will revisit the daily FVG and golden pocket Fibonacci zone.
Disclosure: I am part of Trade Nation's Influencer program and receive a monthly fee for using their TradingView charts in my analysis.
Thanks for your support.
- Make sure to follow me so you don't miss out on the next analysis!
- Drop a like and leave a comment!

GOLD ROUTE MAP UPDATEHey Everyone,
Great finish after completing each of our targets throughout the week with ema5 lock confirmations on our proprietary Goldturn levels. Yesterday we finished off with 3388 and stated we would look for ema5 cross and lock above 3388 to open 3428 and failure to lock will follow with a rejection.
- This played out perfectly with the cross and lock confirmation and then the target hit at 3428 completing the range.
BULLISH TARGET
3318 - DONE
EMA5 CROSS AND LOCK ABOVE 3318 WILL OPEN THE FOLLOWING BULLISH TARGETS
3352 - DONE
EMA5 CROSS AND LOCK ABOVE 3352 WILL OPEN THE FOLLOWING BULLISH TARGET
3388 - DONE
EMA5 CROSS AND LOCK ABOVE 3388 WILL OPEN THE FOLLOWING BULLISH TARGET
3428 - DONE
We’ll be back now on Sunday with our multi-timeframe analysis and trading plans for the week ahead. Thanks again for all your likes, comments, and follows.
Wishing you all a fantastic weekend!!
Mr Gold
GoldViewFX

GOLD - Price can correct to support level and then bounce upHi guys, this is my overview for XAUUSD, feel free to check it and write your feedback in comments👊
Gold entered a Rising Channel structure, demonstrating stable growth with higher highs and higher lows.
After testing and breaking through the $3265 support level, the price pulled back slightly and then resumed its upward momentum.
This move confirmed buyer strength and renewed interest in the mid-channel zone.
Recently, Gold successfully retested the $3365–$3375 support area, turning it into a local springboard.
Now price is gaining traction above this zone and appears to be preparing for a continuation of the current trend.
I expect it to rise toward the $3450 target — the upper resistance of the channel.
If this post is useful to you, you can support me with like/boost and advice in comments❤️
Disclaimer: As part of ThinkMarkets’ Influencer Program, I am sponsored to share and publish their charts in my analysis.

Ethereum - This structure decides everything!Ethereum - CRYPTO:ETHUSD - trades at a key structure:
(click chart above to see the in depth analysis👆🏻)
After Ethereum retested the previous all time high in the end of 2024, we saw quite a harsh move lower. This move was followed by an expected recovery, however Ethereum is still trading below a key structure. Either move is still possible and will shape the future of Ethereum.
Levels to watch: $2.500, $4.000
Keep your long term vision!
Philip (BasicTrading)

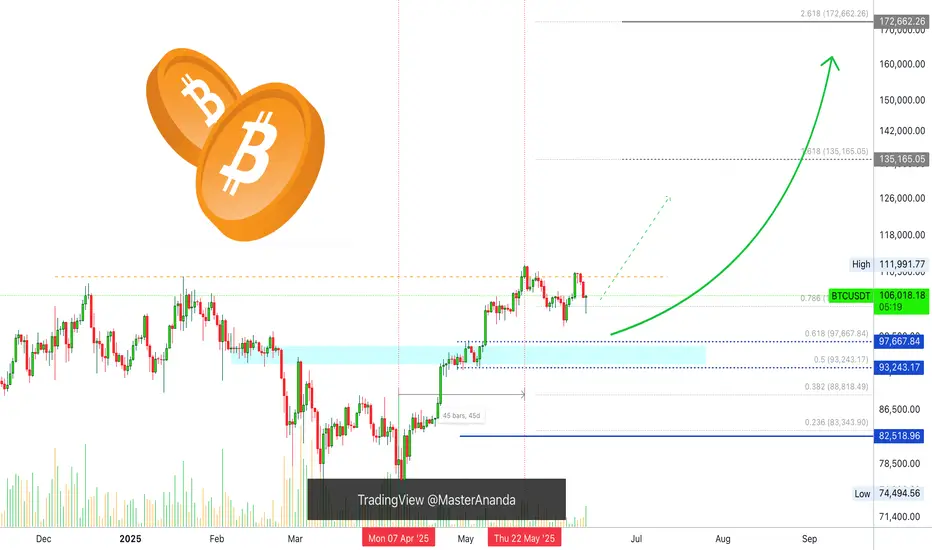
Bitcoin, Good News & Good News —Bullish Confirmed (Retrace Over)First, the good news is that we have a higher low and a strong recovery in place. The current candle has a long lower wick and is already trading green, at the top of the session.
The second good news is how far down the retrace went. Last time Bitcoin bottomed around $100,300, this time the bottom happened at $102,660. This is an early signal of course because the week is not yet over. It can happen that prices move higher today and tomorrow they move back down, crash on Sunday and we get a bearish close. But, looking at short-term price action and other altcoins, also the volume—notice the volume—we can say that the retrace is over and we are set to experience immediately additional growth.
The volume is the most revealing signal right now.
The drop had no volume compared to today. Today's session has more volume than the last three red-days combined.
Another signal to consider is the amount of over-leveraged gamblers that were liquidated, a total of 1 billion dollars. When this much greed is removed from the market, there is no need for lower prices.
I will call it early, the retrace is over. Time to go bullish again.
Thanks a lot for your continued support.
I will show you several more altcoins that are also looking ready to grow.
Namaste.
GBP/JPY - Triangle Breakout (12.06.2025)The GBP/JPY Pair on the M30 timeframe presents a Potential Selling Opportunity due to a recent Formation of a Triangle Breakout Pattern. This suggests a shift in momentum towards the downside in the coming hours.
Possible Short Trade:
Entry: Consider Entering A Short Position around Trendline Of The Pattern.
Target Levels:
1st Support – 194.34
2nd Support – 193.76
🎁 Please hit the like button and
🎁 Leave a comment to support for My Post !
Your likes and comments are incredibly motivating and will encourage me to share more analysis with you.
Best Regards, KABHI_TA_TRADING
Thank you.
Disclosure: I am part of Trade Nation's Influencer program and receive a monthly fee for using their TradingView charts in my analysis.

US DOLLAR INDEX(DXY): Classic Bearish SetupI believe that 📉DOLLAR INDEX has a potential to continue falling.
The market has been consolidating in a wide intraday horizontal range, and the breakout below the range support is a significant bearish indicator.
Target levels are 98.08 then 97.80 support.

Trading Recommendations for the BTC/USDU.S. Treasury Secretary Scott Bessent stated yesterday that USD-backed stable coins could reach a market capitalization of $2 trillion or more. His remarks indicate growing governmental interest in cryptocurrencies, particularly stable coins, as a potentially vital component of the future financial system. Bessent emphasized that with proper regulation, stable coins could enhance payment efficiency, reduce transaction costs, and expand access to financial services for millions of people.
He also noted that stable coins could help broaden the global use of the U.S. dollar and that congress is advancing legislation requiring such coins to be backed by high-quality assets like U.S. Treasury bonds.
It's worth noting the U.S. Senate yesterday voted 68 to 30 to pass the Stable coin Regulation Act, bringing it closer to final approval. If enacted, the legislation could lead to a 10x increase in stable coin supply over the next for years - up to $2 trillion. As a result, stable coin issuers may acquire up to $1.6 trillion in U.S. government bonds for their reserves.
As for the medium-term strategy , I will continue to capitalize on deep pullbacks in Bitcoin and Ethereum, anticipating continuing the broader bullish market trend.
As for short-term trading, the strategy and conditions are described below.
Scenario 1: Buy Bitcoin today on a break above $108,1000, with a target of $108,700. Exit the buy position near $108,700 and open a short on the pullback. Before buying, ensure the 50-day moving average is below the current price and the Awesome Oscillator is in positive territory.
Scenario 2: Buy from the lower boundary of $107,500 if there is no market reaction to its breakout, aiming for a reversal back to $108,100 and $108,700.
Sell Scenario
Scenario 1: Sell Bitcoin today from $107,500, targeting $106,800. Exit shorts at $106,800 and consider buying on the bounce. Confirm that the 50-day moving average is above the current price, and the Awesome Oscillator is in negative territory.
Scenario 2: Sell from the upper boundary at $108,100 if there is no follow-through breakout, targeting $107.500 and $106,800.

EURGBP draws a false breakoutExit from consolidation provokes distribution and price growth by 1%, the daily ATR is exhausted. The currency pair is forming a false breakout of resistance. The retest of the zone of interest 0.8526 and price consolidation below the level may provoke distribution
Scenario: there is no potential for growth continuation beyond 0.8538. The distribution ends with a false break of resistance and price entry into the selling zone. Consolidation under 0.8526 will confirm the break of the structure, which may be the first step towards 0.8482 or 0.8458.

BTCUSDEventually anything goes up sooner or later goes down especially speculative and high liquidity market this is the system or core process and nothing is impossible.
Again, it's just simple prediction based on simple technical analysis there are so many other factors involve where to market would be next move means its only just forming not confirmed yet once again just scenario. NOT FA.

EUR/USD Bulls in Control... But the Trap Is Set at 1.1600? 🇺🇸 EUR/USD – Technical & Macro Outlook
EUR/USD has posted an impressive rally over the past few weeks, driven by a combination of technical and macro factors. It is currently trading around 1.1586, right at the edge of a major supply zone where previous sharp rejections and reversals have taken place.
🔍 Technical Analysis
Price action remains within a well-defined ascending channel that began in mid-April, fueling the bullish move from the 1.07 lows.
The current daily candle is showing signs of exhaustion within the 1.1550–1.1600 resistance zone, with upper wicks and declining volume.
RSI is in a high-neutral zone but not yet overbought, leaving room for more upside — but also increasing the probability of a technical pullback.
🔁 Key Levels:
Primary resistance: 1.1600 (multi-touch supply area)
Support 1: 1.1460–1.1430 (previous resistance, now potential support)
Support 2: 1.1300–1.1270 (demand zone + channel base)
📉 COT Report – June 3, 2025
Non-Commercials (speculators) remain net-long with over 200,000 contracts, though both long (-1,540) and short (-4,830) positions saw reductions. This suggests a bullish structure with early signs of profit-taking.
Commercials are heavily net-short, with 575,000 short contracts versus 437,000 long — a structurally bearish stance from physical market participants.
Open interest increased significantly by +20,813, pointing to renewed speculative participation and potential volatility.
🧭 Retail Sentiment
Retail traders are heavily short (80%) with an average entry around 1.1253.
This contrarian behavior is typically supportive of continued upside pressure — especially if price holds above key supports.
📅 Seasonality – June
Historical averages over 10, 15, and 20 years show a slightly bullish tendency in June.
The 2- and 5-year patterns suggest more neutral to mildly bearish behavior.
This supports a consolidation or corrective pullback, without ruling out higher moves during the summer rally.
🎯 Trading Conclusion
Current bias: Moderately bullish, with rising pullback risks near 1.1600
Possible setup: Tactical short between 1.1580–1.1610 if confirmed by bearish price action
Target: 1.1430–1.1300
Bullish scenario remains valid unless we break below 1.1270
📌 Summary
The bullish trend is strong but technically extended. Speculative positions remain net-long but are starting to unwind. The retail crowd is still betting against the move, which favors bulls. However, structural resistance calls for caution — a pullback could be imminent.

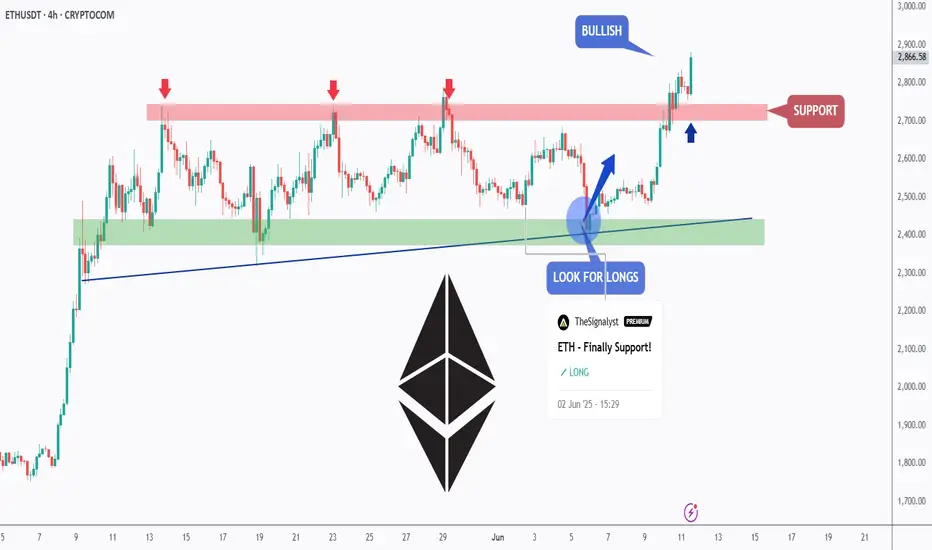
ETH - Medium-Term Bulls Confirmed Control!Hello TradingView Family / Fellow Traders. This is Richard, also known as theSignalyst.
📈 As per our previous ETH analysis (shown on the chart), ETH rejected the green support zone and pushed higher, reaching our target near $2,750.
What’s next?
After breaking above the $2,750 structure marked in red, the bulls have confirmed medium-term control.
🏹 As long as the last major low at $2,700 holds, ETH is expected to remain bullish, with a potential move toward the $3,500 resistance zone.
📚 Always follow your trading plan regarding entry, risk management, and trade management.
Good luck!
All Strategies Are Good; If Managed Properly!
~Rich